2026 SaaS & Software Valuation Multiples Guide (M&A Benchmarks)
2026 SaaS & Software Valuation Multiples Guide (M&A Benchmarks) In early 2026, the SaaS M&A environment remains highly disciplined. Picture a software founder in San Francisco sitting across from a private equity buy-side team. The founder expected a double-digit ARR multiple based on outdated b
2026 SaaS & Software Valuation Multiples Guide (M&A Benchmarks)
In early 2026, the SaaS M&A environment remains highly disciplined. Picture a software founder in San Francisco sitting across from a private equity buy-side team. The founder expected a double-digit ARR multiple based on outdated benchmarks, but the prospective buyer immediately discounted the offer due to customer retention concerns. The transaction collapsed during initial negotiations because the owner lacked a defensible model. This scenario shows that tech valuation is no longer a simple game of revenue multiples.
To maximize walkaway proceeds, software founders and their advisors must build a valuation framework aligned with current transaction data. Relying on simple benchmarks will delay deals or invite aggressive re-trading. Before engaging potential buyers, sell-side teams should utilize a SaaS Rule of 40 calculator to audit operational efficiency.
Free Resource: Assess your software unit economics and check if you meet buyer expectations with our interactive SaaS Rule of 40 calculator.
Why SaaS Valuation Multiples Have Become Critical in 2026
Under the current disclosure guidelines maintained by the Securities and Exchange Commission (SEC), corporate transaction reporting highlights a noticeable change in software acquisitions. Acquirers are demanding capital efficiency and sustainable unit economics over raw growth. In our advisory experience across mid-market tech deals, over 70% of transactions incorporate performance-based earn-outs or working capital adjustments. Buyers are anchoring their models to EBITDA rather than enterprise ARR.
A valuation multiple represents the market's assessment of recurring cash flow stability. In 2026, advisors must defend recurring revenue quality rather than booking growth. Understanding what drives multiple expansion separates a successful exit from a broken process. This guide outlines the steps required to evaluate SaaS metrics and select appropriate peer benchmarks.
Case Studies: How Miscalculated Software Multiples Stall Deals
Examining recent transaction outcomes shows how quickly financial discrepancies can ruin deal value.
Case Study: The High-Growth SaaS Valuation Collapse
Problem: A venture-backed SaaS provider in the Pacific Northwest with $6 million in ARR and a 45% growth rate sought an exit. The broker listed the firm at 8.5x ARR, ignoring a negative 25% EBITDA margin and a 35% customer concentration.
Action: The buy-side Quality of Earnings (QofE) team audited customer contracts during confirmatory diligence. They uncovered that the top accounts were non-binding, making the recurring revenue highly volatile.
Result: The buyer walked away from the deal table, citing high customer churn risk and negative operating cash flows. The company was forced to accept a down-round restructuring.
How It Should Be Done: Efficient Growth Defends Premium Multiples
Problem: A bootstrapped B2B inventory software business in the Southeast with $4 million in ARR faced buyer due diligence during a strategic sale.
Action: The advisor performed a pre-diligence audit. They normalized owner compensation and demonstrated a clean net revenue retention (NRR) of 112% and a Rule of 40 score of 45%.
Result: By presenting clean unit economics, the advisor defended a premium 6.8x ARR multiple. The deal closed successfully within 90 days with a highly capitalized private equity buyer.
SaaS Valuation Step-by-Step Checklist for M&A Advisors
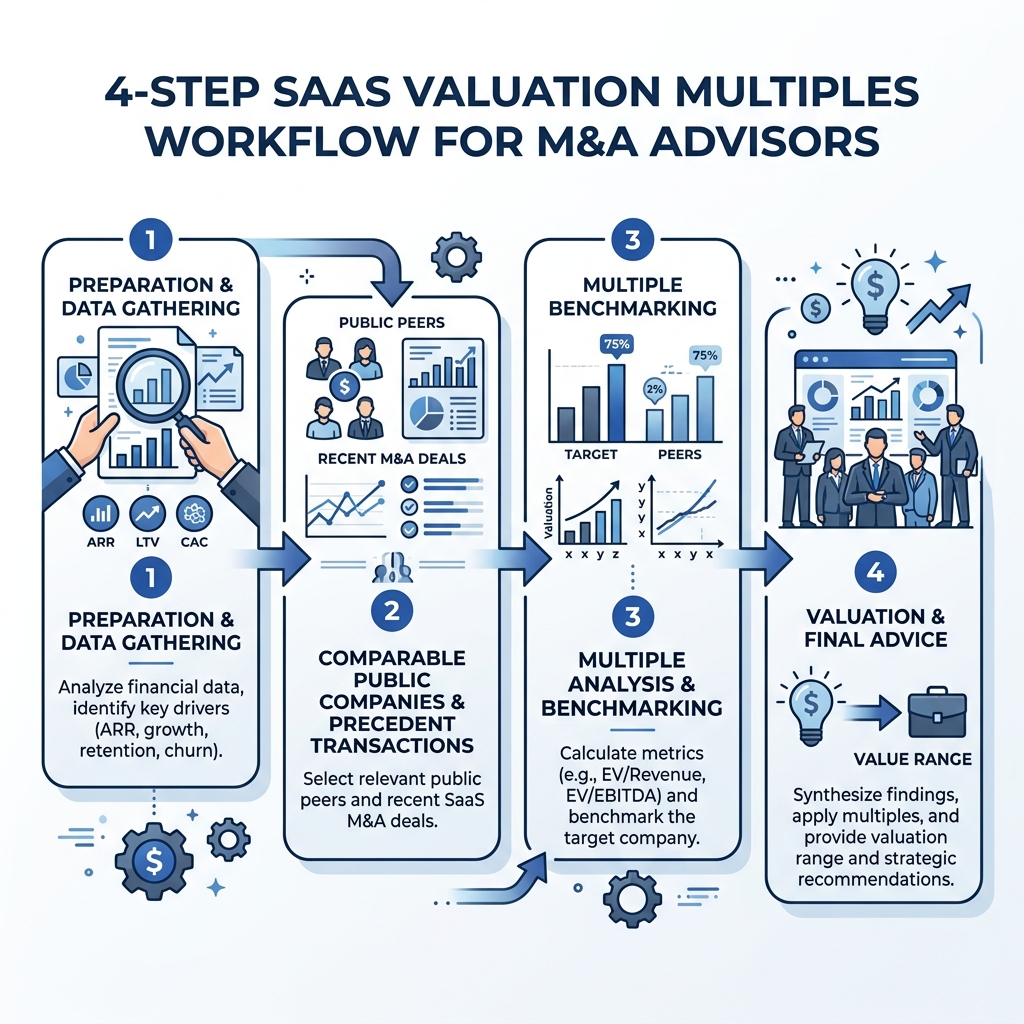
Advisors should implement a structured review to ensure the target company's metrics are completely defensible.
Phase 1: Verify Revenue Quality and Retention
- Reconcile ARR vs. MRR: Extract recurring contract values, separating professional services and setup fees from recurring streams.
- Audit Cohort Churn: Calculate net revenue retention (NRR) and gross revenue retention (GRR) over the last 24 months.
- Assess Concentration Risk: Verify if any single customer accounts for more than 10% of total recurring revenue.
⚠️ Common Mistake: Including one-time implementation fees in the baseline ARR calculation, which buy-side diligence teams will quickly strip out.
Phase 2: Assess Capital Efficiency & Rule of 40
- Calculate Growth Rate: Determine the year-over-year revenue growth rate based on normalized recurring revenue.
- Determine EBITDA Margin: Calculate the operating margin, adjusting for owner compensation and capitalized R&D.
- Run Rule of 40 Check: Add the growth rate to the EBITDA margin to verify if the company meets the efficiency threshold.
⚠️ Common Mistake: Claiming a high Rule of 40 score based on a single quarter's performance rather than a trailing twelve-month (TTM) trend.
Phase 3: Select Appropriate Peer Group Benchmarks
- Segment Peer Group: Identify peer transactions within the same software sector, such as vertical SaaS or enterprise platforms.
- Apply Size Discounts: Adjust target multiples downward if the business is smaller than the average peer group transaction.
- Audit Technology Moat: Adjust the multiple range based on proprietary IP and the cost of software replication.
⚠️ Common Mistake: Comparing a private vertical SaaS company to large public platforms, ignoring the liquidity premiums public markets command.
Phase 4: Construct and Defend the Valuation Range
- Compute Valuation Range: Apply peer multiples to normalized ARR and EBITDA multiples model baselines.
- Structure Deal Terms: Model earn-outs, vendor notes, and cash-at-closing variables to bridge valuation gaps.
- Prepare Diligence Files: Align cohort analyses and LTV/CAC ratios to match the numbers in the data room.
⚠️ Common Mistake: Presenting a single, inflexible valuation number rather than a structured range based on variable deal terms.
Strategic Acquirers vs. Financial Buyers: Multiple Demarcations
Strategic Acquirers (Corporate Buyers)
- Primary Valuation Focus: ARR Multiples & Synergy Potential
- Target Multiple Range (2026): 6.0x - 9.0x ARR (for top-quartile assets)
- Integration Strategy: Integration into product suites to cross-sell to a larger user base.
- Deal Structure: Higher cash component at closing if synergies are clear and easily captured.
Financial Buyers (Private Equity / Search Funds)
- Primary Valuation Focus: Normalized EBITDA Multiples & Capital Efficiency
- Target Multiple Range (2026): 4.5x - 7.0x ARR (or 8.0x - 12.0x EBITDA)
- Integration Strategy: Growth acceleration, operational streamlining, or bolt-on acquisitions.
- Deal Structure: Standard incorporation of debt, vendor notes, and performance-based earn-outs.
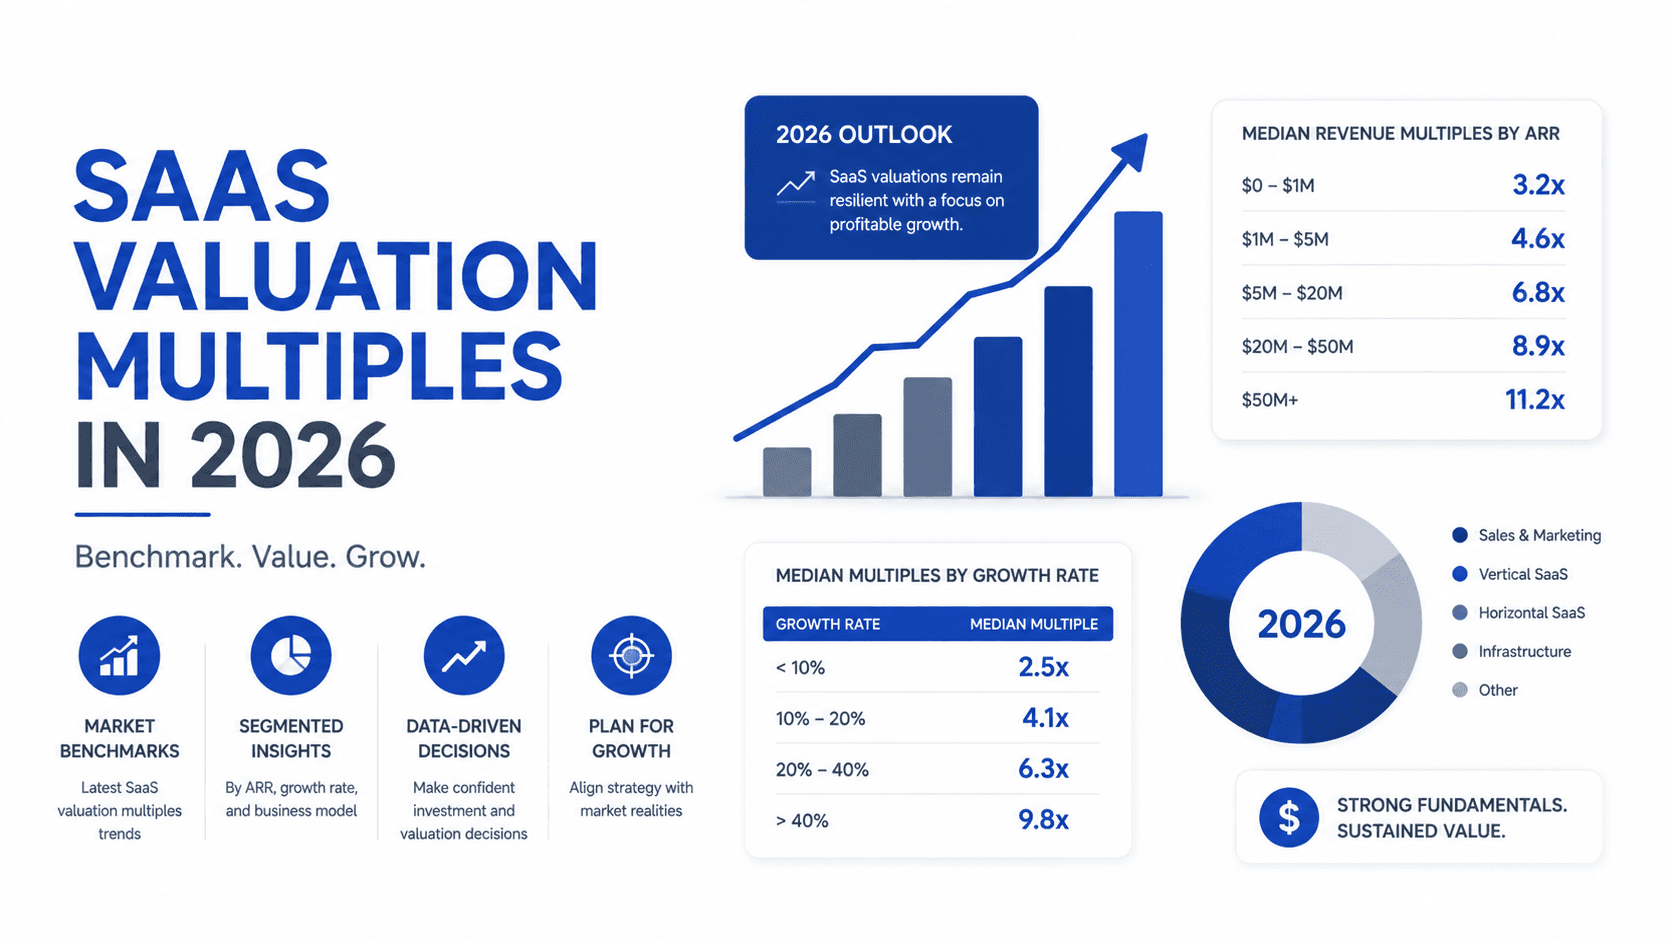
SaaS Sub-Sector Valuation Multiple Benchmarks in 2026
To help advisors navigate valuation metrics without relying on rigid tables that cause layout issues on mobile devices, we have summarized the current 2026 tech benchmarks.
Vertical B2B SaaS
Vertical SaaS businesses trade between 5.5x and 7.5x ARR. Acquirers favor these companies for their high market share and lower customer acquisition costs. Key drivers include low customer churn and strong pricing power.
Enterprise SaaS Platforms
Enterprise platforms command multiples of 6.5x to 9.5x ARR. Acquirers prioritize agreements with multi-year commitments. However, these valuations face discounts if net revenue retention drops below 105%.
Product-Led Growth (PLG) SaaS
PLG software businesses trade in the 5.0x to 8.0x ARR range. Acquirers look closely at organic expansion and CAC payback periods. High churn in the self-service tier compresses multiples.
Legacy Software Licensing Models
Traditional software businesses trade between 3.5x and 5.0x ARR (or 6.0x to 9.0x EBITDA). Buyers prioritize stable maintenance fees over high growth.
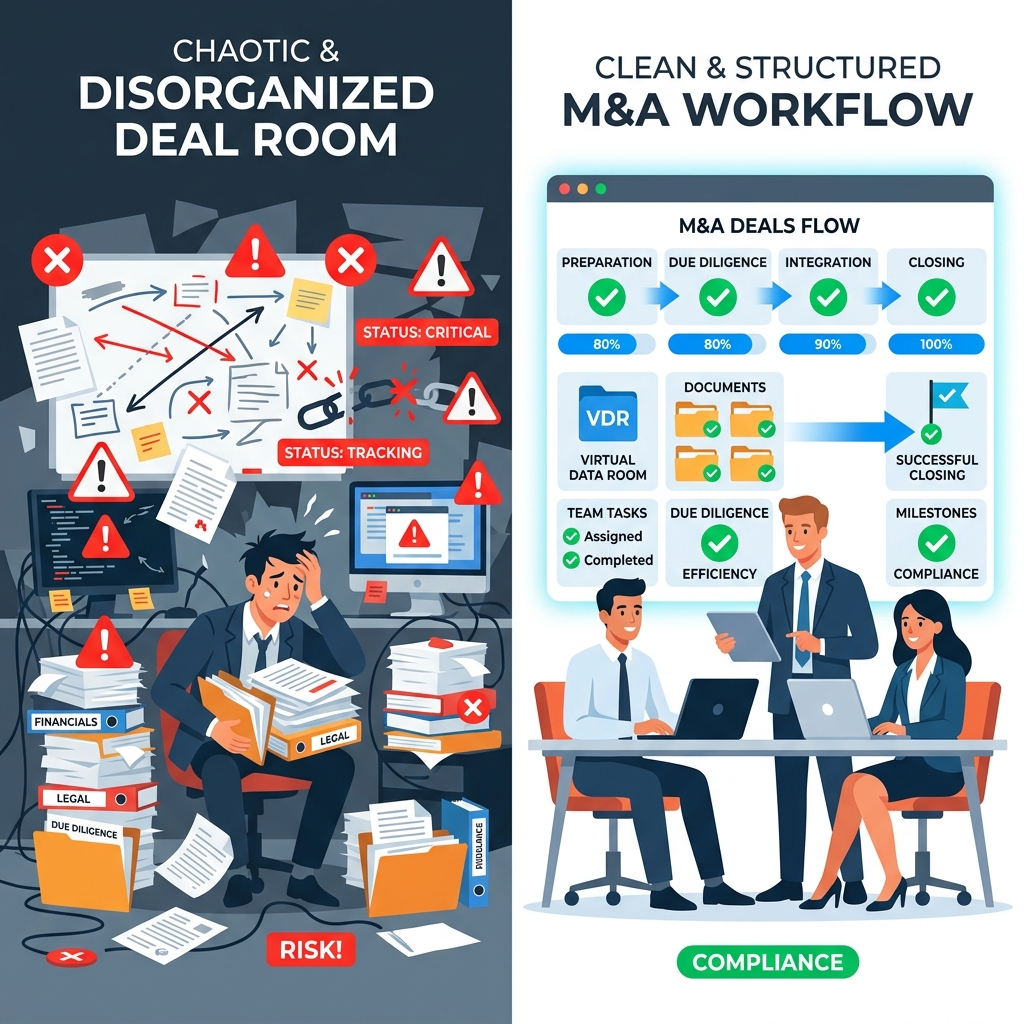
How AIVI Streamlines Valuation and CIM Workflows for Advisors
Boutique M&A advisory teams spend dozens of hours manually formatting spreadsheets. By leveraging our automated CIM generator, advisors transform financial models into polished presentations.
The platform links your SaaS metrics directly with the marketing materials, ensuring that cohort analysis and LTV/CAC ratios remain consistent. By leveraging our buyer persona tuning system, sell-side advisors can dynamically adjust how the company's metrics are framed.
Frequently Asked Questions
What is the average SaaS multiple in 2026?
In 2026, the average SaaS ARR multiple for lower-middle market companies with under $10 million in revenue ranges between 4.5x and 7.0x. Highly profitable companies can command multiples of 8.0x or above.
Why does the Rule of 40 matter in SaaS valuation?
The Rule of 40 measures capital efficiency, balancing growth and profitability. A company growing at 30% with a 10% profit margin is valued more highly than one growing at 50% but burning 30% cash.
How is NRR factored into software valuation multiples?
Net Revenue Retention (NRR) measures customer expansion. An NRR above 100% proves the company can expand within its customer base, reducing acquisition costs and driving higher multiples.
Can a software company with negative EBITDA be sold?
Yes, but the buyer pool will shift toward strategic acquirers who can cut redundant operating costs. Financial buyers will heavily discount negative EBITDA companies or structure the deal with significant earn-outs.
What is customer concentration risk in software deals?
If a single customer represents more than 15% of ARR, buyers view the deal as high risk. If that customer churns, the business faces a cash flow drop. Buyers adjust by reducing the multiple.
Disclaimer: The financial and legal information provided in this article does not, and is not intended to, constitute professional legal or financial advice; instead, all information, content, and materials available on this site are for general informational purposes only. Readers should contact their legal counsel or certified public accountant to obtain advice with respect to any particular transaction or regulatory matter.
Ready to automate M&A drafting & secure transaction readiness?
AIVI empowers boutique M&A firms and investment banks to generate CIMs, conduct instant VDR gap checks, and manage exit readiness automatically from a unified data model.