3 Financial Bubbles to Avoid When Calculating Synergies
3 Financial Bubbles to Avoid When Calculating Synergies In early 2026, building a defensible merger model requires separating realistic operational savings from financial speculation. Imagine an investment banking analyst in New York preparing a valuation model for a tech-enabled distributor. Th

3 Financial Bubbles to Avoid When Calculating Synergies
In early 2026, building a defensible merger model requires separating realistic operational savings from financial speculation. Imagine an investment banking analyst in New York preparing a valuation model for a tech-enabled distributor. The analyst projected $4.0 million in annual synergies from software consolidation and sales crossovers, applying this value directly to the standalone cash flows. The corporate buyer accepted the valuation premium at closing, only to find that merging the IT platforms required a complete system overhaul. The integration delays cost the acquirer millions, erasing the projected savings and destroying transaction value.
To protect deal outcomes, advisory teams must understand how to avoid these common M&A valuation traps. Using our synergy estimator calculations helps advisors model synergy structures under different integration scenarios. Correctly calculating synergy risk ensures that your transaction projections remain realistic.
Free Resource: Model synergy risk adjustments and verify your merger assumptions with our interactive synergy premium estimator.
The Dangerous Allure of Over-Estimated Synergies in 2026 M&A
Under financial accounting guidelines maintained by the Securities and Exchange Commission (SEC), companies must document acquisition assumptions and write down assets if synergy targets fail. In addition, antitrust reviews managed by the Federal Trade Commission (FTC) check if efficiency claims are supported by real data. If an acquisition fails to meet its projected savings, the buyer must record impairment charges, hurting their financial performance.
This regulatory pressure means that advisors cannot afford to present speculative savings. The transition from standalone entities to a combined firm involves hidden friction. Recognizing these obstacles before closing is the key to preventing transaction inflation.
Case Studies: The Destructive Power of Synergy Calculation Failures
Real transactions demonstrate the financial impact of overestimating operational overlaps.
Case Study: The Double-Counted Revenue Expansion Flop
Problem: A boutique advisory firm represented a software firm with $20 million in revenue. The analyst projected $3.0 million in cost savings while simultaneously projecting a 25% revenue growth rate from cross-selling.
Action: During integration, the corporate buyer found that the target's sales team was busy adjusting to the new product line, causing them to neglect existing accounts.
Result: Customer churn rose to 18%, offsetting the projected cross-selling gains. The transaction failed to deliver any net synergy value, and the buyer wrote down $4.5 million in goodwill.
How It Should Be Done: De-Risked Operational Modeling
Problem: An industrial logistics firm in the Southeast planned to acquire a regional competitor to expand its shipping network.
Action: The sell-side advisor modeled synergy risk by separating cost savings from revenue assumptions and applying a 20% discount rate to the projected savings.
Result: The advisor presented a realistic, risk-adjusted valuation range. The buyer accepted the defensible model, and the integration achieved the target savings on schedule.
Operational Checklist for Identifying and Reducing Synergy Risks
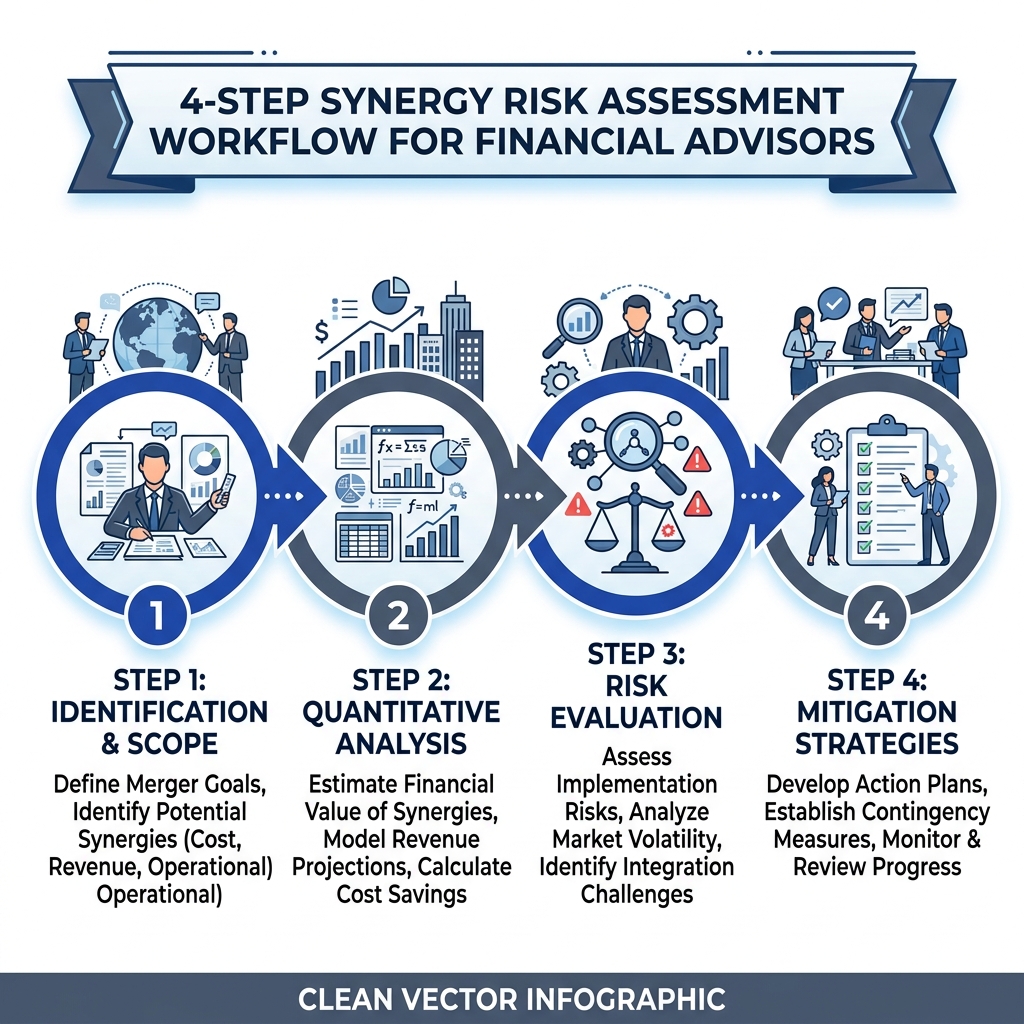
Deal teams should use this checklist to audit and stress-test synergy assumptions before closing.
Phase 1: Auditing IT Systems and Integration Complexity
- Review Codebases: Check if the target’s software applications use compatible APIs and frameworks.
- Evaluate Data Security: Analyze the target’s database compliance with current data protection rules.
- Estimate Migration Costs: Calculate the cost of migrating customer records to the buyer's systems.
⚠️ Common Mistake: Assuming different ERP systems can be merged without incurring developer costs or workflow delays.
Phase 2: Verifying Staff Rationalization and Severance Costs
- Compare Org Charts: Locate duplicate positions across finance, marketing, and corporate support divisions.
- Calculate Severance Liability: Determine the cost of severance packages for employees whose roles will be eliminated.
- Map Talent Retention: Identify key employees who require retention bonuses to stay through the integration period.
⚠️ Common Mistake: Projecting immediate personnel savings while ignoring contractual severance obligations.
Phase 3: Stress-Testing Customer Retention Rates
- Analyze Client Concentration: Check if a few customers drive a large portion of the target's revenue.
- Model Churn Scenarios: Calculate the financial impact if customer churn increases by 5%, 10%, or 15% post-closing.
- Draft Transition Plans: Build joint account management structures to support client transition.
⚠️ Common Mistake: Assuming all existing customers will remain loyal after their accounts are transferred to a larger buyer.
Phase 4: Calibrating Post-Closing Integration Timelines
- Define Milestones: Establish clear deadlines for system migration and office consolidation.
- Assign Managers: Nominate an integration manager to oversee the transition of key operations.
- Track Synergy Capture: Set up monthly reporting cycles to compare actual savings against the original deal model.
⚠️ Common Mistake: Assuming integration will be completed within 90 days, which leads to budget overruns.
Realized Synergies vs. Projected Synergy Assumptions
Realized Synergies
- Calculation Basis: Measured by auditing actual expenses and revenues post-closing.
- Risk Adjustments: Factored in actual implementation costs and transition delays.
- Valuation Alignment: Shows the true financial value created by the combination.
Projected Synergy Assumptions
- Calculation Basis: Estimated during due diligence using standalone historical financials.
- Risk Adjustments: Often ignores integration delays and employee turnover risks.
- Valuation Alignment: Can inflate enterprise value if assumptions are not stress-tested.
Typical Synergy Risk Allowances by Transaction Size in 2026
We have summarized standard synergy risk parameters below to support deal structuring.
Lower-Middle Market Allocations
Acquisitions under $30 million typically discount projected synergies by 25% to 35% due to higher key-man dependencies.
Mid-Market Integration Allowances
Deals in the $30 million to $100 million range apply synergy risk discounts of 15% to 25%, depending on system compatibility.
Large-Scale Corporate Combinations
Deals over $100 million use a risk discount of 10% to 15%, relying on dedicated integration departments.
Cross-Border Regulatory Allowances
Transactions involving international entities apply a risk discount of 30% or more to account for currency and legal differences.
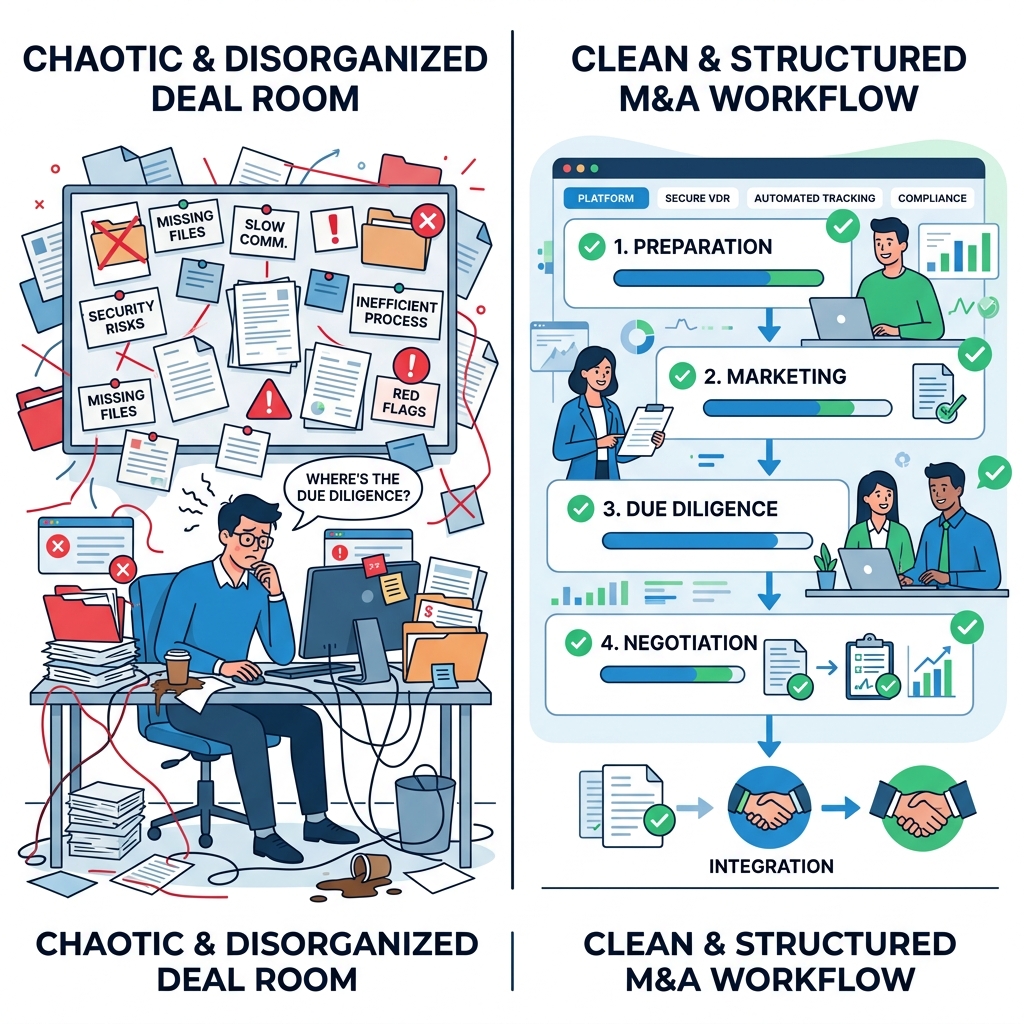
Using Professional Diligence Platforms to Identify Integration Obstacles
Boutique advisors often struggle to project integration risks in spreadsheets. By using our Synergy Radar capabilities, transaction teams can identify system overlaps and operational bottlenecks before closing.
In addition, utilizing our automated CIM generation tools helps advisors present risk-adjusted models to buyers. The platform connects customer databases with valuation models, ensuring consistency across all marketing materials. Advisors can verify their calculations by using our synergy estimator calculations to ensure their valuations remain defensible.
Frequently Asked Questions
What is synergy risk and how does it affect business valuations?
Synergy risk is the probability that projected merger savings will not be realized. High risk increases WACC, which lowers the present value of the combined firm.
What are the common pitfalls in calculating cost synergies?
Advisors often overlook severance costs, system integration fees, and the operational delays required to consolidate departments.
How do you avoid double-counting revenues in merger models?
Advisors must separate organic revenue growth projections from cross-selling assumptions to prevent inflating cash flow forecasts.
Why do regulatory agencies check synergy assumptions?
Regulatory bodies like the FTC verify efficiency claims to confirm that mergers deliver real benefits rather than just reducing competition.
How does a synergy estimator simplify risk adjustments?
The tool applies historical risk discounts to projected savings, allowing advisors to build defensible valuation models for buyers.
Disclaimer: The financial and legal information provided in this article does not, and is not intended to, constitute professional legal or financial advice; instead, all information, content, and materials available on this site are for general informational purposes only. Readers should contact their legal counsel or certified public accountant to obtain advice with respect to any particular transaction or regulatory matter.
Ready to automate M&A drafting & secure transaction readiness?
AIVI empowers boutique M&A firms and investment banks to generate CIMs, conduct instant VDR gap checks, and manage exit readiness automatically from a unified data model.