How to Calculate WACC: A Step-by-Step Tutorial for M&A Advisors (2026)
How to Calculate WACC: A Step-by-Step Tutorial for M&A Advisors (2026) The Weighted Average Cost of Capital (WACC) is the single number that connects a company's capital structure to its valuation. In a discounted cash flow (DCF) model, every dollar of projected future earnings gets divided
How to Calculate WACC: A Step-by-Step Tutorial for M&A Advisors (2026)
The Weighted Average Cost of Capital (WACC) is the single number that connects a company's capital structure to its valuation. In a discounted cash flow (DCF) model, every dollar of projected future earnings gets divided by a factor that includes WACC — which means a one-percentage-point change in WACC can shift enterprise value by fifteen to twenty-five percent in a lower-middle-market transaction.
For boutique M&A advisors, understanding WACC is not optional. Buyers use it to set bid prices. Sellers' advisors use it to challenge bid assumptions. Investment bankers use it to run DCF sensitivity tables. And private equity firms use it to reverse-engineer the minimum EBITDA growth required to hit their return targets.
This tutorial walks through the complete WACC calculation — formula, inputs, common mistakes, and a worked example — in the order a practitioner actually needs to learn it. Use our free WACC calculator to run your own calculation as you follow each step.
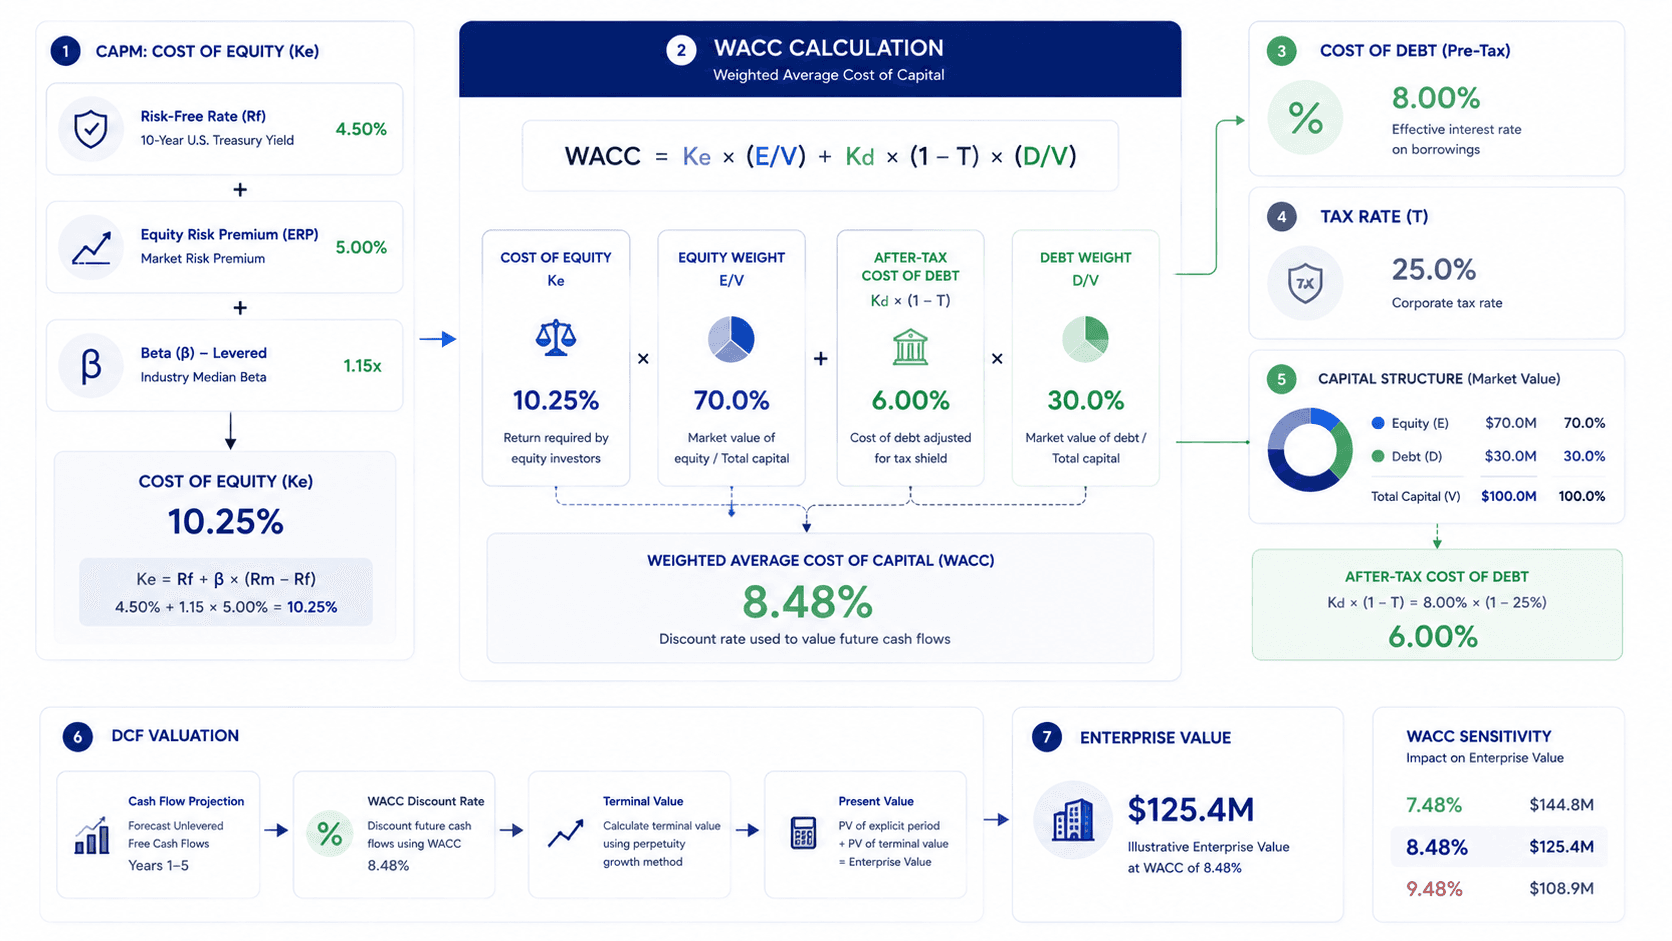
Key Answer: WACC = [Cost of Equity × (Equity / Total Capital)] + [Cost of Debt × (1 – Tax Rate) × (Debt / Total Capital)]. The most complex input is Cost of Equity, calculated via CAPM.
What Is WACC and Why Does It Matter in M&A?
WACC stands for Weighted Average Cost of Capital. It represents the blended rate of return that a company must generate — across all its capital sources — to remain economically viable. In M&A valuation, WACC serves as the discount rate in a DCF model: the rate used to convert future cash flows back to present-day value.
A lower WACC means future cash flows are worth more today — which mathematically produces a higher enterprise value. A higher WACC compresses valuations. This is why sell-side advisors seek to demonstrate a defensibly low WACC, while buy-side analysts tend to use slightly higher rates to provide a pricing buffer.
Why WACC Matters for the Purchase Price
In practical terms: if a company generates $2M of free cash flow annually and you discount at 10% WACC in perpetuity, the terminal value is approximately $20M. At 8% WACC, that same cash flow yields $25M — a 25% valuation difference from a 2-point WACC adjustment.
This is why WACC inputs are contested in deal negotiations. Equity risk premiums, beta selections, and capital structure assumptions are all negotiable in practice — and experienced advisors on both sides know it.
The WACC Formula: Complete Breakdown
The standard WACC formula is:
WACC = [Ke × (E/V)] + [Kd × (1 – T) × (D/V)]
Where:
- Ke = Cost of Equity (the return equity investors require)
- E = Market Value of Equity
- V = Total Capital (Equity + Debt)
- Kd = Cost of Debt (pre-tax interest rate on borrowings)
- T = Corporate Tax Rate
- D = Market Value of Debt
Each component has its own calculation. Let's work through them in order.
Step 1: Calculate the Cost of Equity (Ke) Using CAPM
Cost of Equity is the return that equity investors — shareholders — require to compensate them for the risk of investing in this particular company. The standard method is the Capital Asset Pricing Model (CAPM):
Ke = Rf + β × (Rm – Rf)
Where:
- Rf = Risk-Free Rate (typically the 10-year US Treasury yield)
- β (Beta) = The company's systematic risk relative to the market
- Rm – Rf = Equity Risk Premium (ERP) — the excess return of the market over the risk-free rate
CAPM Inputs in Practice (2026)
Risk-Free Rate: As of 2026, the 10-year US Treasury yield is a common proxy. Use the current yield at the time of the analysis — not a historical average.
Equity Risk Premium: Damodaran's annual ERP estimates are the industry standard. For US markets in 2026, a range of 4.5% to 5.5% is commonly used. Choose a defensible source and document it.
Beta: For private companies (which is most of the lower-middle market), beta must be estimated from publicly traded comparables. Steps:
- Identify 4–8 publicly traded companies in the same industry with similar revenue profiles
- Pull each company's levered beta from a financial data source
- Unlever each beta using the comparable's capital structure: Unlevered β = Levered β / [1 + (1–T) × (D/E)]
- Take the median or average of unlevered betas
- Re-lever using the subject company's target capital structure: Re-levered β = Unlevered β × [1 + (1–T) × (D/E)]
What We Actually See In Deals: In lower-middle-market M&A, most private company valuations use an industry median beta from a handful of comparables. The beta selection is often the most argued input in a WACC negotiation — buyers typically use higher betas (more risk) and sellers' advisors argue for lower ones (more comparable to mature businesses in the sector).
Worked Example — Cost of Equity
Assume:
- Risk-Free Rate (Rf): 4.5%
- Industry Re-levered Beta (β): 1.15
- Equity Risk Premium (ERP): 5.0%
Ke = 4.5% + 1.15 × 5.0% = 4.5% + 5.75% = 10.25%
Step 2: Calculate the After-Tax Cost of Debt (Kd × (1–T))
The Cost of Debt is simpler: it is the company's effective interest rate on its borrowings. The key adjustment is the tax shield — because interest payments are tax-deductible, the net cost of debt to the company is lower than the nominal rate.
After-Tax Cost of Debt = Kd × (1 – T)
How to Find Kd
For companies with existing debt: use the weighted average interest rate across all outstanding debt instruments (term loans, revolvers, bonds).
For companies without significant debt (common in lower-middle-market targets): use the rate a creditworthy company of similar size would pay for senior secured debt. Current market rates for lower-middle-market senior secured debt in 2026 typically range from 7% to 10% depending on leverage, EBITDA, and sector.
Worked Example — After-Tax Cost of Debt
Assume:
- Pre-Tax Cost of Debt (Kd): 8.0%
- Corporate Tax Rate (T): 25%
After-Tax Cost of Debt = 8.0% × (1 – 0.25) = 8.0% × 0.75 = 6.0%
Step 3: Determine the Capital Structure Weights (E/V and D/V)
The weights reflect what proportion of the company's total capital comes from equity versus debt. In a DCF-based WACC, best practice is to use target or industry-typical capital structure weights — not the company's current balance sheet — because WACC is meant to represent the ongoing cost of capital, not a momentary snapshot.
Capital Structure for Private Companies
Private companies in the lower-middle market are often founder-owned with minimal formal debt. For WACC purposes, apply an industry-typical leverage ratio rather than the company's actual debt-free balance sheet, since a buyer will likely add leverage at closing.
Common approaches:
- Use the median debt-to-capital ratio of the public comparable set identified for the beta analysis
- For M&A valuations, buyers often assume 40–60% debt weighting in LBO scenarios
Worked Example — Capital Structure
Assume industry-typical target structure:
- Equity Weight (E/V): 60%
- Debt Weight (D/V): 40%
Step 4: Assemble the Full WACC Calculation
Using our worked example inputs:
| Input | Value |
|---|---|
| Cost of Equity (Ke) | 10.25% |
| After-Tax Cost of Debt | 6.00% |
| Equity Weight (E/V) | 60% |
| Debt Weight (D/V) | 40% |
WACC = (10.25% × 60%) + (6.00% × 40%) WACC = 6.15% + 2.40% WACC = 8.55%
This 8.55% becomes the discount rate in the DCF model. Every year of projected free cash flows is divided by a cumulative factor that compounds at 8.55% annually. Terminal value — typically the largest component of enterprise value — is calculated by dividing the final year's normalized free cash flow by (WACC minus the long-term growth rate).
Run this same calculation with your company's specific inputs using our free WACC calculator, which handles the CAPM cost of equity and tax shield automatically.
WACC by Industry: What Range Should You Expect?
WACC varies significantly by sector, primarily driven by differences in beta (systematic risk) and typical capital structure. The table below reflects general ranges for 2026 in US lower-middle-market M&A:
| Industry | Typical WACC Range | Primary Driver |
|---|---|---|
| SaaS / Technology | 12% – 18% | High beta, growth uncertainty |
| Professional Services | 10% – 14% | Revenue concentration, key-person risk |
| Healthcare Services | 9% – 13% | Reimbursement risk, regulatory exposure |
| Manufacturing | 9% – 12% | Capital intensity, cyclicality |
| Distribution / Logistics | 8% – 11% | Asset backing, stable cash flows |
| Food & Beverage | 8% – 11% | Recurring demand, commodity risk |
| Utilities / Infrastructure | 6% – 9% | Low beta, regulated revenue |
Advisors Note: These ranges are starting points, not conclusions. A SaaS business with 130% NRR, five-year contracts, and zero customer concentration may warrant a WACC at the low end of the tech range. A manufacturing business with two customers comprising 60% of revenue may warrant a premium to the sector range. The beta and risk premium components should reflect the company's actual risk profile, not just its sector membership.
Common WACC Calculation Mistakes
Mistake 1: Using Book Value Instead of Market Value Weights
Book value debt-to-equity ratios reflect historical accounting, not current market reality. WACC should always use market-value weights. For private companies, estimate equity market value from comparable trading multiples and use outstanding debt balance as the debt market value.
Mistake 2: Applying a Single WACC Across Different Risk Segments
If a company has two distinct business lines — one stable and one early-stage — a blended WACC may understate the appropriate discount rate for the riskier segment. Consider calculating segment-level WACCs for businesses with materially different risk profiles.
Mistake 3: Ignoring the Size Premium
The standard CAPM model was developed using large-cap public company data. For private companies in the lower-middle market, practitioners commonly add a Size Premium (SP) of 3% to 5% to reflect the additional systematic risk of smaller companies:
Ke = Rf + β × (Rm – Rf) + SP
Duff & Phelps (now Kroll) publishes annual size premium tables by decile that are widely accepted in business valuation.
Mistake 4: Using the Wrong Tax Rate
Use the company's effective marginal tax rate — not the statutory rate. Companies with significant NOL carryforwards, tax credits, or special deductions may have an effective rate meaningfully below the statutory 21% federal rate.
How WACC Connects to EBITDA Multiple Valuation
In M&A transactions, buyers use two parallel valuation methodologies: DCF (which requires WACC) and comparable company analysis (which produces EBITDA multiples). Both methods should produce roughly consistent conclusions if the inputs are internally coherent.
The mathematical relationship: a lower WACC implies a higher present value of future cash flows, which in turn implies a higher EBITDA multiple — because buyers are willing to pay more for the same earnings stream when their required return is lower.
This connection explains why interest rate environments affect M&A multiples. When base rates rise, risk-free rates increase, WACC increases, and the mathematically supportable EBITDA multiple compresses.
For a complete guide to how EBITDA multiples work in business valuation — and how to use them alongside WACC-based DCF analysis — see our EBITDA multiple valuation guide. To run a quick enterprise value estimate alongside your WACC calculation, use the EBITDA valuation calculator.
Worked Example: Full WACC-to-Enterprise-Value Calculation
Let's put WACC into context with a complete valuation example.
Company Profile:
- Normalized EBITDA: $3.5M
- Less: D&A: ($400K)
- EBIT: $3.1M
- Less: Taxes (25%): ($775K)
- NOPAT: $2.325M
- Less: CapEx and Working Capital Changes: ($200K)
- Free Cash Flow (FCF): $2.125M
Assumptions:
- WACC: 10% (using our worked example calculation, adjusted for size premium)
- Long-Term Growth Rate (g): 3.0%
- Projection Period: 5 years (for simplicity, assume FCF grows at 5% per year)
Year 1–5 DCF:
| Year | FCF ($K) | PV Factor (10%) | PV ($K) |
|---|---|---|---|
| 1 | 2,231 | 0.909 | 2,028 |
| 2 | 2,343 | 0.826 | 1,935 |
| 3 | 2,460 | 0.751 | 1,848 |
| 4 | 2,583 | 0.683 | 1,764 |
| 5 | 2,712 | 0.621 | 1,684 |
| Sum of PV | 9,259 |
Terminal Value:
- Terminal FCF (Year 6): $2,712K × 1.03 = $2,793K
- Terminal Value = $2,793K / (10% – 3%) = $2,793K / 7% = $39,900K
- PV of Terminal Value = $39,900K × 0.621 = $24,778K
Enterprise Value = $9,259K + $24,778K = $34,037K ≈ $34M
At $3.5M EBITDA, this implies a valuation multiple of approximately 9.7x EBITDA — reasonable for a well-positioned lower-middle-market business with predictable cash flows. If WACC had been 8% instead of 10%, enterprise value would be closer to $42M (approximately 12x EBITDA) — illustrating how material the WACC assumption is.
Frequently Asked Questions
What is a good WACC for a small business?
For lower-middle-market private businesses (typically $2M–$15M EBITDA), a typical WACC range is 10% to 18%, with the wide variation driven by industry, customer concentration, management depth, revenue quality, and the assumed capital structure. Highly stable, asset-backed businesses may fall below 10%; early-stage or high-growth businesses with significant key-person risk may exceed 18%.
How does WACC affect a business's sale price?
WACC directly determines the discount rate in a DCF model. A lower WACC produces a higher present value for the same stream of projected earnings, which supports a higher enterprise value and purchase price. In M&A negotiations, the WACC inputs — particularly beta, equity risk premium, and capital structure weights — are often debated because even small differences can produce significant valuation changes at deal scale.
What is the difference between WACC and required rate of return?
WACC is the rate required by all capital providers collectively — a blended rate across equity holders and debt holders. Required rate of return typically refers to the return demanded by equity investors specifically. In M&A valuation, WACC is used as the discount rate because it reflects the full cost of capital, not just the equity return requirement.
Why is the cost of debt multiplied by (1 - tax rate)?
Interest payments on corporate debt are tax-deductible under most jurisdictions' tax codes. This creates a "tax shield" — the government effectively subsidizes part of the interest cost by reducing the company's taxable income. Multiplying by (1 - T) adjusts the nominal interest rate to reflect this subsidy, which is the actual net cost of borrowing to the company after tax benefits.
Can WACC be used for all M&A transactions?
WACC-based DCF analysis is most reliable when: the business has stable, predictable free cash flows; the projection period is long enough to reflect the investment thesis; and the terminal growth assumption is reasonable relative to the industry and macroeconomic environment. For early-stage companies with volatile cash flows, venture-backed startups, or businesses in highly cyclical industries, WACC-based DCF may require substantial modification or supplementation with other methods such as revenue multiples or precedent transaction analysis.
Disclaimer: The financial and legal information provided in this article does not, and is not intended to, constitute professional legal or financial advice; instead, all information, content, and materials available on this site are for general informational purposes only. Readers should contact their legal counsel or certified public accountant to obtain advice with respect to any particular transaction or regulatory matter.
Ready to automate M&A drafting & secure transaction readiness?
AIVI empowers boutique M&A firms and investment banks to generate CIMs, conduct instant VDR gap checks, and manage exit readiness automatically from a unified data model.