How to Create a Synergy Map in M&A: Quantifying Acquisition Value Before You Bid
How to Create a Synergy Map in M&A: Quantifying Acquisition Value Before You Bid A synergy map is the structured framework that transforms "this acquisition makes strategic sense" into a number a board can defend. Every corporate acquirer and private equity sponsor knows that synergies exis
How to Create a Synergy Map in M&A: Quantifying Acquisition Value Before You Bid
A synergy map is the structured framework that transforms "this acquisition makes strategic sense" into a number a board can defend.
Every corporate acquirer and private equity sponsor knows that synergies exist in theory. The acquisition of a complementary business should produce cost savings, revenue opportunities, or both. But until those synergies are mapped — documented by category, quantified with a timeline, and stress-tested against realistic assumptions — they are not an input into the offer price. They are a wish.
The deals that close at premium valuations are the ones where the buyer has built a credible, detailed synergy map before entering exclusivity. The deals that retrade — where the purchase price drops between LOI and closing — are often the ones where synergies were assumed rather than analyzed.
This guide explains how to build a synergy map that is specific enough to use in deal structuring, credible enough to defend in management presentations, and practical enough to inform the actual offer price. Use our Synergy & Premium Estimator to run a quantified synergy model alongside this framework.
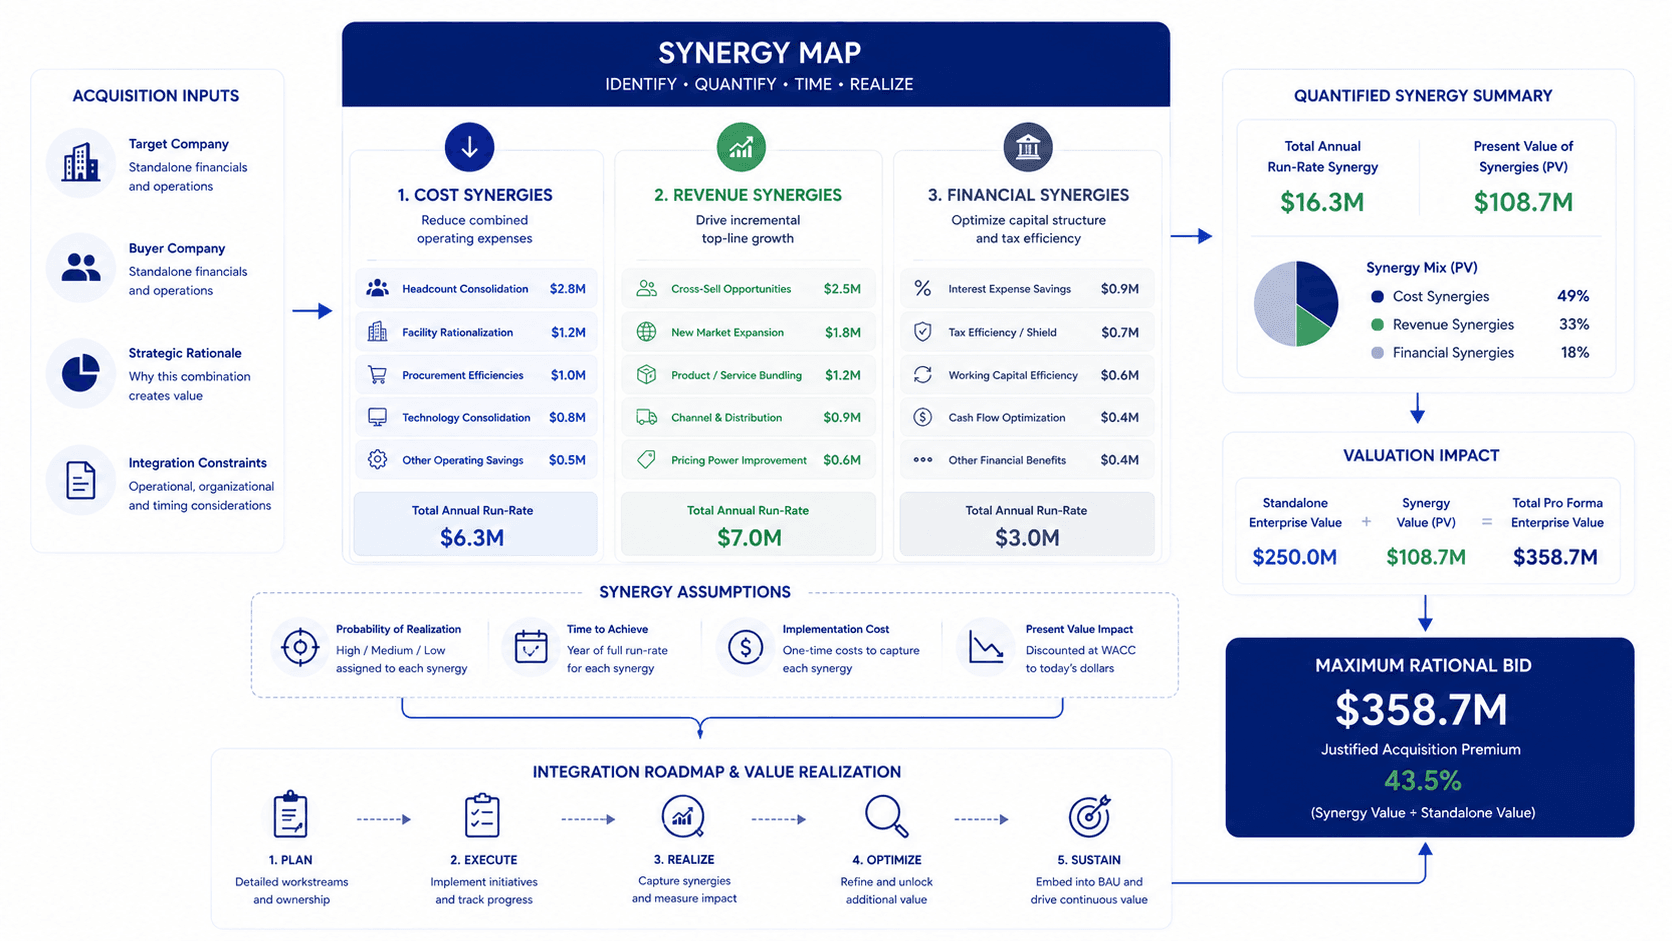
Key Answer: A synergy map categorizes and quantifies acquisition synergies across three types — cost synergies, revenue synergies, and financial synergies — and assigns each a probability, timeline, and implementation cost to arrive at a present value of total synergy benefit.
What Is a Synergy Map?
A synergy map is a structured visual and analytical framework that documents every identifiable source of value creation from a proposed acquisition. Unlike a general "strategic rationale" slide, a synergy map is specific: it names the synergy, estimates the annual value, assigns an implementation timeline, and quantifies the one-time cost to capture it.
The output is typically a two-dimensional grid or tree diagram with three primary branches:
- Cost Synergies — operational cost reductions achieved by combining two entities
- Revenue Synergies — incremental revenue opportunities created by the combination
- Financial Synergies — capital structure and tax benefits from combining the entities
For each synergy source, the map captures:
- Annual steady-state dollar impact (once fully realized)
- Year the synergy is expected to reach full run-rate
- One-time implementation cost (severance, integration, systems consolidation)
- Probability of realization (high / medium / speculative)
This structure produces a defensible, present-value-adjusted synergy benefit that can be added to the standalone DCF value to arrive at a maximum rational acquisition price.
Why Synergy Maps Matter: The Acquisition Premium Problem
In competitive M&A processes, buyers routinely pay premiums of 20% to 50% above standalone business value. The question every acquirer must answer is: what premium is rational, and what is the ceiling?
The ceiling is the point at which the acquisition is value-neutral — where the premium paid exactly equals the present value of synergies achieved. Paying above that ceiling destroys shareholder value (the classic "winner's curse").
A rigorously built synergy map solves this problem by giving the buyer's investment committee a specific, documentable answer: "We can pay up to $X without destroying value, and here is why."
The synergy map becomes the justification for competing aggressively in a process rather than backing away from a number that feels high. It also prevents overpayment by making explicit which synergies are achievable and which are speculative.
What We Actually See In Deals: The most common synergy analysis mistake is treating synergies as a single number without distinguishing between highly certain cost synergies and highly speculative revenue synergies. A $2M annual synergy estimate that is 70% cost savings and 30% revenue upside is very different from one that is 20% cost savings and 80% revenue upside. The present value calculation should weight each category by its probability of realization.
The Three Categories of Synergies: A Framework
1. Cost Synergies
Cost synergies are reductions in combined entity expenses that arise directly from the merger. They are typically the most quantifiable and the most reliable to achieve.
Common Cost Synergy Sources:
Headcount consolidation — Eliminating duplicate functions that both companies maintain independently. Corporate overhead (finance, HR, legal, IT, marketing) is the most common area. The calculation: identify overlapping FTEs, apply loaded compensation (salary + benefits + payroll taxes), subtract transition costs (severance), and net to an annual run-rate savings.
Facilities rationalization — Closing redundant office locations, warehouses, or manufacturing facilities when the combined entity no longer needs both. Calculate: annual rent / occupancy savings, net of lease breakage costs and relocation expenses.
Procurement leverage — Combined purchasing power with shared vendors typically produces 3% to 8% savings on addressable spend. Identify categories where both companies use the same vendors, aggregate spend, and apply a conservative savings rate.
Technology consolidation — Eliminating duplicate SaaS licenses, maintenance contracts, and IT infrastructure when one platform can serve the combined entity. This is often underestimated in lower-middle-market deals where both companies have independently built out their tech stacks.
Timeline for Cost Synergies: Most cost synergies have clear implementation paths and are typically achievable within 12 to 24 months post-close. This makes them more valuable on a present-value basis than revenue synergies with longer time horizons.
2. Revenue Synergies
Revenue synergies are incremental revenue opportunities created by the combination. They are typically less certain than cost synergies and have longer realization timelines — which means their present value is lower despite sometimes carrying larger headline numbers.
Common Revenue Synergy Sources:
Cross-selling — Selling the acquirer's products to the target's customer base (or vice versa). The key inputs: size of the addressable cross-sell universe, expected penetration rate, and average contract value. Penetration rates of 10% to 20% in the first two years are commonly used; higher rates should be treated as speculative.
Geographic expansion — Using the acquisition to enter markets where only one entity had previously operated. Value the incremental revenue opportunity using the acquiring market's unit economics applied to the new geography.
Product extension — Combining the two entities' product or service lines to serve a broader customer need, reducing client attrition or enabling upsell. Calculate: retention improvement × average account value, plus incremental upsell conversion rate × addressable base.
Accelerated go-to-market — In technology acquisitions, integrating the target's product into the acquirer's distribution channels typically accelerates growth versus the target's standalone trajectory. Quantify the difference between accelerated and standalone growth projections.
Timeline for Revenue Synergies: Most revenue synergies require customer relationship development, sales process integration, and sometimes product integration. Realistic timelines are 18 to 36 months for meaningful realization — which substantially reduces their present value relative to cost synergies.
3. Financial Synergies
Financial synergies arise from the combined entity's improved capital structure, tax position, or access to capital.
Common Financial Synergy Sources:
Debt capacity increase — A combined entity with larger, more diversified cash flows may support more leverage at favorable rates. The value: if WACC decreases due to a higher debt mix, enterprise value increases on the existing DCF.
Tax benefits — Using the target's NOL carryforwards, step-up in asset basis (in an asset deal), or eliminating pass-through tax leakage (in an S-corp acquisition). These require tax counsel analysis but can represent material value in specific deal structures.
Cost of capital reduction — A larger combined entity may access public markets or institutional debt at tighter spreads, reducing the discount rate applied to future cash flows.
Building the Synergy Map: A Step-by-Step Process
Step 1: Conduct the Operational Alignment Audit
Before quantifying synergies, you need to understand how the two businesses actually operate at a functional level. The audit covers:
- Organizational chart comparison: identify functional overlaps at every level
- Technology stack comparison: catalog SaaS platforms, ERP systems, and IT infrastructure for both entities
- Customer list cross-reference: identify existing customer overlap and cross-sell potential
- Vendor list comparison: identify shared or overlapping procurement categories
- Real estate footprint: map all locations and identify geographic redundancy
This audit is typically conducted by the buy-side deal team and advisors using the seller's VDR materials during confirmatory diligence. This is why sellers who maintain a well-organized data room — with clear organizational data, technology contracts, and customer schedules — enable better synergy analysis, which often supports better offers.
Step 2: Build Category-Level Synergy Estimates
For each synergy category identified in the audit, build a bottom-up estimate:
Format:
| Synergy Category | Annual Steady-State Value | Realization Year | One-Time Cost | Probability |
|---|---|---|---|---|
| Headcount — Finance/HR | $450K | Year 1 | $120K severance | High (90%) |
| Facilities — Boston office | $180K | Year 2 | $85K lease termination | High (85%) |
| Cross-sell — Existing accounts | $620K | Year 3 | $150K sales headcount | Medium (55%) |
| Procurement — IT vendors | $95K | Year 1 | Minimal | High (80%) |
Build this table from the audit output, not from general assumptions. Every row should trace to a specific data source.
Step 3: Apply Probability Weights and Timeline Discounting
The synergy map is only useful if it distinguishes between what is probable and what is possible.
Apply probability weights to annual values, then discount each year's probability-adjusted synergy benefit back to present value at the deal's WACC. This converts the synergy map from a list of possibilities into a specific present-value number that can be added to the standalone DCF.
Use our Synergy & Premium Estimator to run this calculation with your specific inputs — it handles the probability weighting, timeline staging, and present value discounting automatically.
Step 4: Calculate the Maximum Rational Premium
Maximum Rational Premium = Present Value of Probability-Adjusted Synergies – Integration Costs
If a business is worth $30M on a standalone basis and the synergy map produces a probability-adjusted PV of $6M in synergies (net of integration costs), the maximum rational offer is $36M — a 20% premium. Paying above $36M requires either higher synergy capture than modeled or an assumption that the standalone DCF is too conservative.
This number becomes the ceiling in the investment committee's bid authorization. The actual bid is typically set 10% to 20% below this ceiling to provide a negotiation buffer.
Case Studies: How Synergy Maps Change Deal Outcomes
Case Study: The Synergy Map That Justified a 35% Premium
A strategic acquirer in the professional services sector was evaluating a regional competitor with $4.2M EBITDA. Standalone DCF analysis at a 12% WACC produced a value of approximately $29M (roughly 7x EBITDA — a discount to market due to the target's customer concentration).
The acquirer's corporate development team built a formal synergy map over four weeks of diligence, identifying:
- $1.2M in annual headcount synergies (functions already performed centrally by the acquirer)
- $380K in facilities savings (target's headquarters 8 miles from acquirer's regional hub)
- $890K in cross-sell revenue potential (25% penetration rate on a 3-year timeline)
- $200K in technology consolidation savings
Probability-adjusted, time-discounted PV of synergies: approximately $9.8M. Combined with standalone value of $29M, this supported a maximum rational bid of approximately $38.8M — representing a 34% premium to standalone.
The acquirer's board approved a bid of $36M. They won the process at that price. Post-acquisition tracking confirmed $1.4M in actual synergies in year 1, slightly ahead of the model.
Case Study: When No Synergy Map Meant Overpaying
A PE-backed roll-up platform acquired a business without a formal synergy map, relying instead on a general statement in the investment memo that "significant synergies are expected" from the combined platform. The purchase price reflected a 40% premium to standalone.
Two years post-close, the integration team identified that the expected headcount synergies required eliminating a regional management structure that had proven more operationally critical than anticipated. Realizing those synergies would have required disrupting key customer relationships.
The synergies were not captured. The purchase price premium was not justified by realized value. The deal underperformed its underwrite by a material margin.
The missing step was a specific, bottom-up synergy map validated against operational reality before the offer was submitted.
Synergy Map vs Standalone Valuation: How to Combine Them
In practice, M&A professionals use synergy maps in conjunction with standalone valuations — not as a replacement. The analytical flow:
- Build standalone DCF value at deal WACC (see our EBITDA valuation calculator for a quick comparable multiple check)
- Build the synergy map and calculate probability-adjusted PV of synergies
- Set maximum rational bid = Standalone + Synergy PV – Integration Costs
- Set actual bid below maximum to preserve negotiation buffer
- Structure purchase price allocation (if relevant) to optimize tax treatment of the premium
For sell-side advisors representing the target, the synergy map analysis works in reverse: identify which buyers would logically capture the most synergies from the acquisition, and target those buyers first in the process to maximize competitive tension at premium valuations.
Our EBITDA multiple valuation guide covers how EBITDA multiples relate to DCF values across industry sectors — useful context for calibrating whether a synergy-justified premium is market-consistent.
Automating Synergy Analysis: The Role of AI in M&A
Building a full synergy map traditionally required weeks of advisor time — functional audits, customer list cross-referencing, technology catalog comparisons. AI-assisted tools are compressing this timeline significantly.
AI-powered synergy analysis tools can:
- Automatically cross-reference customer lists between acquirer and target to identify cross-sell potential without manual data reconciliation
- Scan contracts for assignment and change-of-control provisions that might limit synergy realization
- Compare organizational structures to identify functional overlap candidates
- Model synergy sensitivity across different probability and timeline assumptions
Advisory teams using the Synergy Radar platform at AIVI integrate this analysis directly into the deal workflow — producing a structured synergy map from VDR data rather than building it manually from scratch.
Frequently Asked Questions
What is the difference between cost synergies and revenue synergies?
Cost synergies are reductions in the combined entity's operating expenses that result directly from combining two organizations — eliminating duplicate functions, consolidating facilities, leveraging combined purchasing power. They are typically more certain and faster to realize than revenue synergies.
Revenue synergies are incremental revenue opportunities created by the combination — cross-selling, geographic expansion, product extension. They require customer relationship development and sales execution that take longer to materialize, making them less certain and less valuable on a present-value basis despite often carrying larger headline numbers.
How do you quantify synergies in M&A?
Quantifying synergies requires bottom-up analysis for each synergy category: identify the specific source (e.g., overlapping headcount in the finance function), estimate the annual dollar impact (loaded compensation for eliminated roles), assign a one-time implementation cost (severance), and apply a probability weight reflecting confidence in realization. The resulting probability-adjusted annual values are then discounted to present value at the deal's WACC to produce a total synergy benefit number.
What is a typical synergy premium in M&A?
Acquisition premiums in public company M&A average 25% to 35% above pre-announcement share price. In private company M&A, the implied premium over standalone DCF value varies significantly by deal structure and strategic fit, but synergy-justified premiums of 15% to 40% are common in strategic transactions. Financial buyers (PE) typically pay premiums closer to standalone value because they cannot capture strategic synergies the way corporate acquirers can.
How long does it take to realize acquisition synergies?
Cost synergies are typically realizable within 12 to 24 months of closing. Revenue synergies commonly take 18 to 36 months to reach meaningful run-rate, and some revenue synergy categories (complex product integrations, enterprise cross-selling) may take three to five years. The timeline differences are why cost synergies are weighted more heavily in most buyer analyses — their present value is higher for the same dollar of annual benefit.
Can a synergy map be used by sell-side advisors?
Yes, and it should be. Sell-side advisors who understand which strategic buyers would generate the most synergies from acquiring their client's business can structure the sale process to maximize competitive tension among the highest-synergy buyers. This means targeting buyers where cross-sell potential is highest, where geographic overlap creates the most facilities rationalization opportunity, or where the target's technology would create the most integration value. This buyer segmentation directly influences which names appear at the top of the process distribution list.
Disclaimer: The financial and legal information provided in this article does not, and is not intended to, constitute professional legal or financial advice; instead, all information, content, and materials available on this site are for general informational purposes only. Readers should contact their legal counsel or certified public accountant to obtain advice with respect to any particular transaction or regulatory matter.
Ready to automate M&A drafting & secure transaction readiness?
AIVI empowers boutique M&A firms and investment banks to generate CIMs, conduct instant VDR gap checks, and manage exit readiness automatically from a unified data model.